Worked-out solution for the FAU Organic Chemistry Thin Layer Chromatography experiment. Three common analgesic drugs — aspirin, acetaminophen, and caffeine — are separated on a silica gel TLC plate using an ethyl acetate / acetic acid (99:1) mobile phase. The retention factor (Rf) of each compound is calculated and used to identify the components of two unknown mixtures.
Thin layer chromatography is a technique used to separate non-volatile compounds based on differences in their polarity. Non-polar compounds are comprised of mainly C–H bonds, and the primary intermolecular forces are weak dispersion forces caused by random fluctuations in electron distribution. Polar compounds possess highly electronegative elements such as oxygen or nitrogen which create a permanent dipole (uneven charge distribution) in the molecule where one side has a partial positive charge, and the other side has a partial negative charge allowing for dipole–dipole interactions.
Thin layer chromatography is usually performed on a TLC plate made of a non-reactive solid coated with silica or alumina. This is known as the stationary phase, and it is highly polar in nature due to the presence of Si–OH or Al–OH bonds. The sample is applied to the bottom of the plate, and the plate is placed in a non-polar organic solvent which is known as the mobile phase. As the solvent travels up the plate, it carries different components along at different rates. Polar compounds are attracted to the polar stationary phase and will only travel a short distance whereas non-polar substances travel a long distance with the solvent.
Unknown compounds can be identified based on their unique retention factor (Rf) which is the distance traveled by the compound divided by the distance traveled by the solvent. In this experiment TLC will be carried out on three analgesic drugs — aspirin, acetaminophen, and caffeine — to investigate their Rf values. You will also be provided with 2 unknown mixtures, and you will need to determine which of the analgesics they contain by matching the Rf values to those of the known compounds.
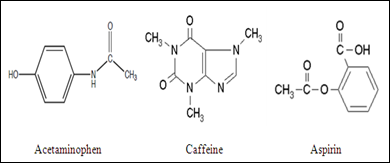
Molecular structures of acetaminophen, caffeine, and aspirin.
Chemicals / Materials
Aspirin
Acetaminophen
Caffeine
Ethyl acetate : acetic acid — 99:1 mixture
TLC plate (silica gel)
Procedure
Draw a line in pencil 1 cm from the bottom of the TLC plate and another line 0.5 cm from the top of the plate (be careful not to scrape off the silica coating).
Using capillary tubes, apply aspirin, acetaminophen, caffeine, and 2 unknowns next to each other on the plate directly on the 1 cm line mark (be careful not to apply too much compound so the spots do not overlap with each other).
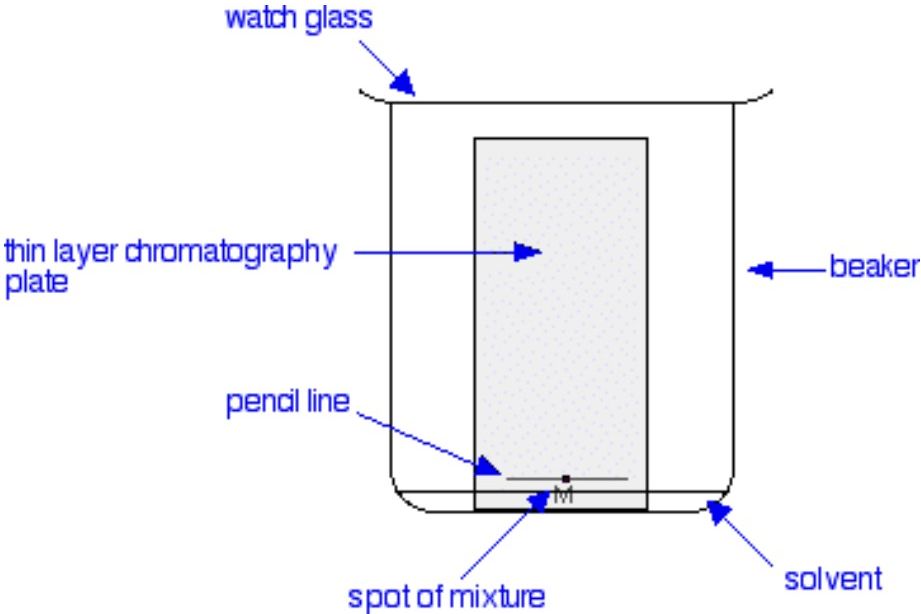
Place the TLC plate in a beaker containing ethyl acetate : acetic acid 99:1 solvent (the level of solvent must be below the 1 cm line mark drawn on the plate).
Allow the solvent to travel up the plate.
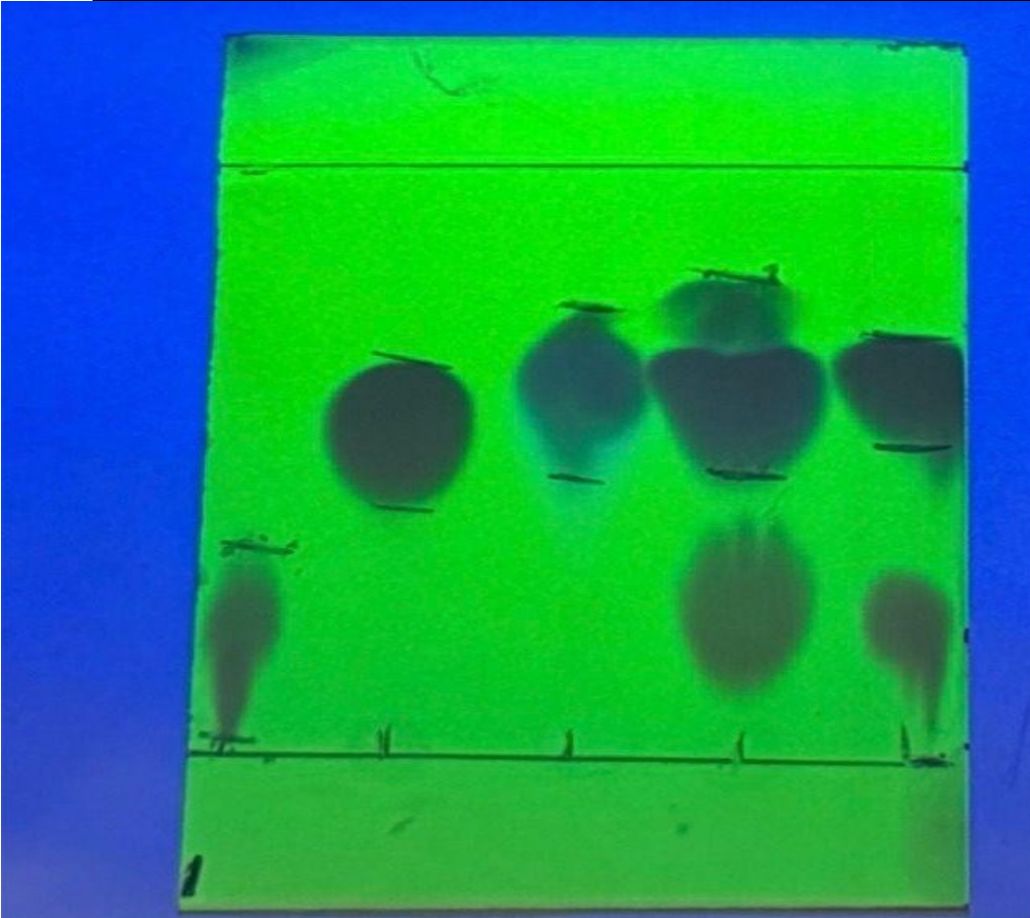
When the solvent reaches about 0.5 cm from the top, remove the plate, draw a line for the solvent front, and use UV light to observe the spots.
Calculate the retention factor (Rf) for each compound (measure distances traveled using the spotting line as the starting point).
Illustration of TLC setup.
Potential Errors to Avoid
Using an ink pen to draw the line — the ink will move up the plate.
Applying compounds too close together.
Uneven solvent front if the plate is not placed straight down into the solvent — will not allow for accurate calculation of Rf.
Solvent level too high — the compounds will dissolve in the mobile phase.
Rf Formula
Rf = (Distance traveled by the compound) / (Distance traveled by the solvent front). Distances are measured from the origin line (spotting line). Rf values range from 0 to 1, and each compound has a characteristic Rf value under the same experimental conditions.
Completed lab report
Answers blurred
Introduction
Thin layer chromatography is a technique used to separate non-volatile compounds based on differences in their polarity. It is commonly used for qualitative analysis to determine the number of components in a sample and to help identify unknown substances by comparison with known standards. The stationary phase in TLC is a thin layer of silica gel coated onto a glass or plastic plate. Silica gel is highly polar due to the presence of silanol (Si–OH) groups on its surface. The mobile phase is a liquid solvent or solvent mixture that travels up the TLC plate by capillary action. In this experiment, the mobile phase was ethyl acetate with 1% acetic acid (99:1). Separation occurs due to competition between the stationary phase and the mobile phase: more polar compounds interact strongly with the polar silica gel and therefore move more slowly up the plate while less polar compounds interact weakly with the stationary phase and travel farther with the mobile phase. The objective of this experiment was to use thin layer chromatography to separate and analyze three common analgesic drugs — aspirin, acetaminophen, and caffeine — based on their polarity, calculate Rf values, and identify the components of unknown mixtures.
Procedure
A thin layer chromatography plate coated with silica gel was prepared by lightly drawing a pencil line approximately 1 cm from the bottom of the plate to mark the origin. A second pencil line was drawn about 0.5 cm from the top of the plate to indicate the maximum solvent travel distance. Using capillary tubes, small amounts of aspirin, acetaminophen, caffeine, and two unknown samples were spotted along the origin line. The prepared TLC plate was then placed upright into a beaker containing a solvent system of ethyl acetate and acetic acid in a 99:1 ratio. Once the solvent front reached approximately 0.5 cm from the top of the plate, the plate was removed, the solvent front was marked with a pencil, and the plate was allowed to dry. The developed spots were visualized using ultraviolet (UV) light. The distances traveled by each compound and by the solvent front were measured from the origin line, and the retention factor (Rf) values for each compound were calculated.
Results — Table 1: Known Compounds
Compound (Lane)
Distance Traveled (cm)
Solvent Front (cm)
Rf
A
1.3
4.5
0.29
B
3.0
4.5
0.67
C
3.4
4.5
0.76
D
3.5
4.5
0.78
E
3.1
4.5
0.69
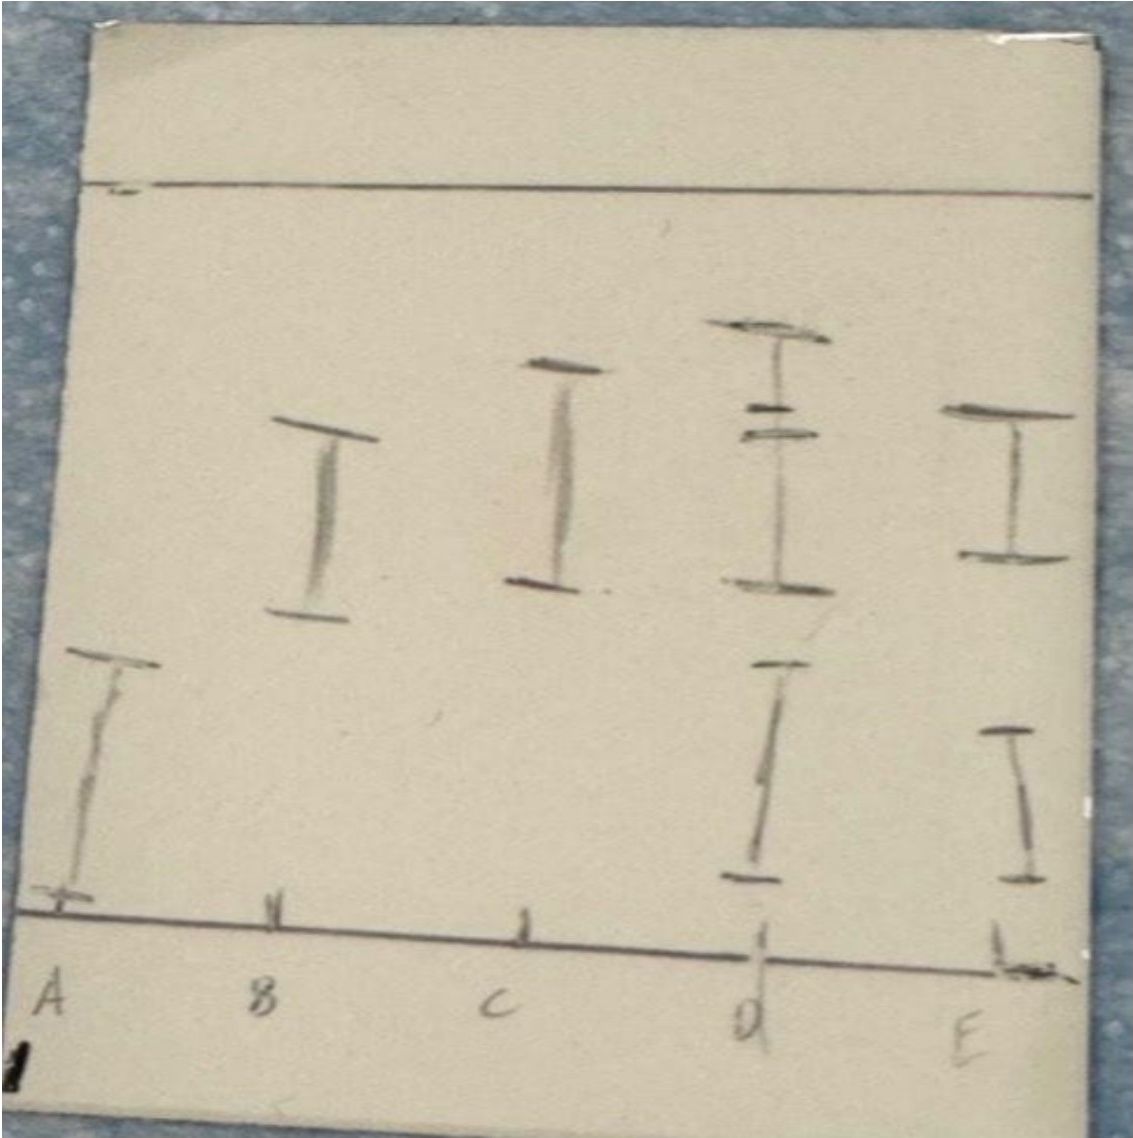
Picture 1: from TLC plate (UV visualization).Picture 2: drawing from TLC plate.
Discussion
Sources of Error and Improvements
Over-spotting which can cause spot diffusion and reduced separation — improved by applying smaller, more dilute samples and allowing spots to dry fully between applications.
Inexact measurement of spot centers which can affect Rf precision — minimized by marking spot centers immediately and using more precise measuring tools.
Minor tailing resulting from uneven silica interactions — reduced by careful handling of TLC plates and proper drying of spots.
Subjectivity in UV visualization which can affect spot identification — improved by consistent UV exposure and prompt marking of spot boundaries.
Separation and Polarity
The TLC experiment successfully separated the analgesic compounds based on polarity. Caffeine, the most polar compound due to multiple nitrogen atoms capable of hydrogen bonding, exhibited the lowest Rf value and traveled the shortest distance. Aspirin, which is less polar due to its aromatic ring and ester functional group, traveled the furthest and showed the highest Rf value. Expected polarity order (most polar → least polar): Caffeine > Acetaminophen > Aspirin.
Therefore unknown 1 contains Caffeine and Acetaminophen.
Unknown 2
1.2 cm → Rf ≈ 0.27
Matches: Rf ≈ 0.29 → Caffeine.
Therefore unknown 2 contains Caffeine only.
Reference
Pavia, D. L.; Lampman, G. M.; Kriz, G. S.; Engel, R. G. Introduction to Organic Laboratory Techniques: A Microscale Approach, 5th ed.; Cengage Learning: Boston, 2013.